The Quality Progress magazine ran a well-written article about measurement systems in their September issue (it is entitled ‘A Study in Measurements’ and was written by Neetu Choudhary).
If you purchase products that have to comply with strict measurement requirements, this is an important topic.
Let’s look at a classic situation.
- A production operator measures a few pieces and finds they are within spec.
- An inspector measures a few pieces from that same batch and finds a few of them out of spec.
- Another inspector, sent by the customer, measures a few other pieces from that same batch and finds most of them out of spec.
The usual reaction? “Production never stops quality issues”, “the customer’s staff is too strict, they are probably trying to get a kickback”, and so on. Very frustrating.
And yet, there is often a clear origin to these discrepancies: different ways to measure the same product.
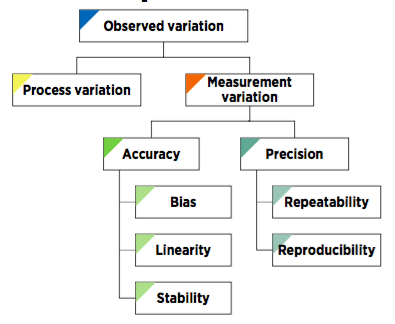
Let’s start with a breakdown of all sources of variation that come from the measurement process itself.
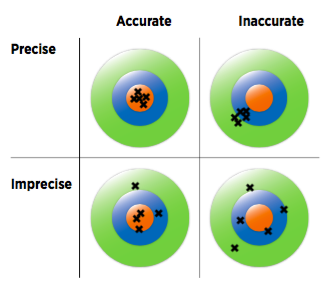
 This graph illustrates nicely the difference between accuracy and precision:
The author writes:
Accuracy is the closeness of a measured value to the true value and is comprised of three components:
- Bias. The difference between the average measured value and the true value of a reference standard.
- Linearity. The change in bias over the normal operating range.
- Stability. Statistical stability of the measurement process with respect to its average and variation over time.
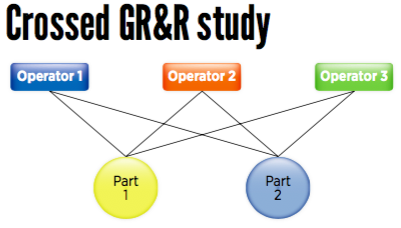
And what about precision? When there are doubts about the validity of a measurement system, precision is usually checked first through a gage repeatability & reproducibility study (GR&R study).
A GR&R study typically doesn’t take more than 1 hour of the operators’ and inspectors’ time, if they are given a clear plan to follow. It doesn’t require them to check hundreds of pieces. Usually it is planned this way:
This type of study shows several types of differences. The source of many frustrations is typically reproducibility, and that concept includes mainly 2 types of differences:
- Between different people (what do they find when checking the same product?)
- Between what a person finds the first time she checks a product, the second time she checks the same product, etc. with the same instrument, in the same conditions, etc.
One can go very deep with this type of study, but in most cases it is not called for. Specialized software such as Minitab can take care of the calculations.
What type of conclusion can it help you draw?
If 30% of the variation comes from the measurement system itself, there is a serious issue! Any decision taken on the basis of measurements is going to be questioned, and for good reason.
In such a case, you will need to make changes such as changing/improving some of the measurement devices, ensuring proper calibration, writing a clear work instruction (how to measure a product), get your customer(s) and suppliers(s) to confirm it, train operators and inspectors, and so forth.


As always Renaud raises some very good questions. All too often people take measurements at face value and assume them to be “truth”. In fact, measurements have variation just as production does. And, in some cases the measurement variation can be large compared to the tolerances involved. When this is true, acceptances are suspect!
Gage R & R study is a great approach to study this. Let me add several other considerations.
1. Measurement correlation. Sometimes the factory and customer measure things using different techniques, different checking tools, etc. Early on this needs to be studied and discrepancies resolved. I am dealing with one of these situations right now where the factory says the products are 100% conforming… but the customer is finding 15% bad. We have done independent checking and have confirmed the customer’s findings. This is an electronic performance test done by a complicated, expensive electrical tester (Fluke brand cable tester, well respected in the industry). Still haven’t figured out what the factory is doing to “pass” the product! We have requested that the factory send detailed test reports, and individual samples; we’ll test on our gear and compare the results on a detailed basis (actual test values, not just pass/fail).
2. Restesting. Suppose there are 10 pieces tested; 9 pass; one fails. The QA person re-tests the failed part and it passes. If testing variation is significant then this could mean that 10% of the shipment is nonconforming, or marginal! Best practice: a formal test procedure that specifies just 1 retest allowed per batch.
3. Sampling integrity. Often when small samples are taken, factory people take the easy way out. Say you can only test 10 pieces per lot. The factory samples 10 pieces. 8 pass. They discard the 2 bad parts and find several more to test, to get 10 passes. They report 10 passes and neglect to report the 2 failures. They rationalize, “only 2 bad pieces”. Truth is that this represents 20% of product!
4. Out and out fraud. I have seen numerous reports where a test report was total fraud. This may be discovered when you ask to see the measurement instrument that was used. Perhaps it didn’t exist! Example: we have a dimension that the factory can only check on a go/no go basis. Yet the test report shows a specific data value. Outright fabrication! Back to Go, no $200!
Lesson learned: Witness the first testing so you know the supplier’s measurement technology.
Caveat emptor!
Brad
These are great points! Thanks Brad!
Renaud,
A follow up both Yours and Brad’s great comments. Going back some years to a situation with my former employer and an assembly factory in Longhua Jiedao, you know the massive plants there. Anyway so we had these 250K GBP electrical testing machines, testing a range of parameters on the passive components we made and we were receiving constant complaints from the end customer who were about to launch their new electronic device which turned the world on it’s head and which was assembled in Longhua.
So two us went there and found the assembly plant was using a row of operators, sitting at benches, using locally made mutlimeters to test the capacitance of said passive components. Long discussions ensued about the relative methods of testing components, until the end customer stepped in on our side.
Always pays to get your boots on and go to the Gemba.
Haha yes I see perfectly… I had similar experiences with this Taiwanese group… With a lot of input from the customer’s engineers, they can have great processes and great lines. And yes it pays to go down to the component manufacturing facilities too…
All of step is easy understanded.One of AQL acceptance q’ty only didn’t clear.May i know how to calculate for major defect and minor defect acceptance rate.
e.g 2 5 4 0 6 5 such as acceptance limit q’ty how to forecast ? This point only can’t catch.
I suggest you read this article: https://qualityinspection.org/what-is-the-aql/