 Whenever some product attributes can be measured, statistical tools can help understand the situation, prioritize improvement efforts, and even help those improvement efforts.
For example, if you measure your product’s size, thickness, or chemical concentration, statistics can help. You can set specification limits and measure products regularly.
Chinese manufacturers are not used to this. Truth be told, I have never seen a Chinese manufacturer, outside of car makers and their tier 1 suppliers, use statistics correctly on their own. However, if they are open to learn, we have found that there are a few basics they can apply easily.
First, you need to define the CTQ (Critical To Quality) product characteristics.
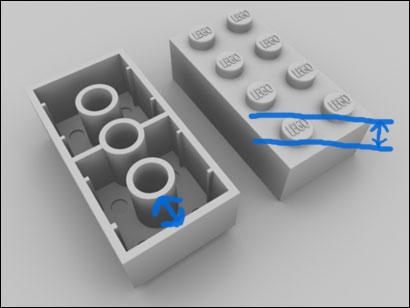
For example, Lego bricks have to fit together nicely. But what does “fit together nicely” mean? Some dimensions need to be consistently the same, with very little variation. For the sake of this exercise, let’s take say there are 2 CTQ characteristics:
- Diameter of the male parts
- Distance between female part and the wall
By measuring those dimensions on the PRODUCT, you will know the PROCESS capability.
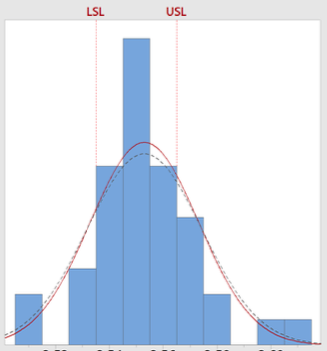
Let’s say you measure these 2 values on 40 pieces.
The diameter value is often out of specifications (LSL = lower specification limit; USL = higher specification limit).
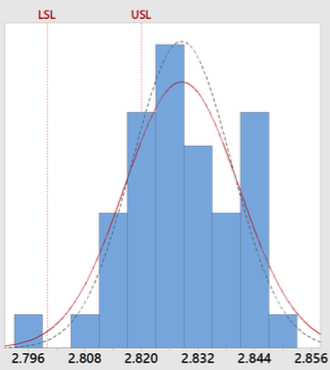
The distance value is very often above the specification. This is more serious and should be worked on in priority.
Let’s say, after you make changes to the mold and you control the temperature during the injection process, the measurements look like this:
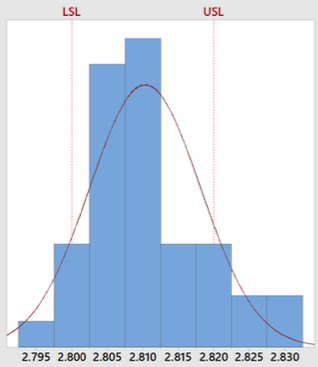
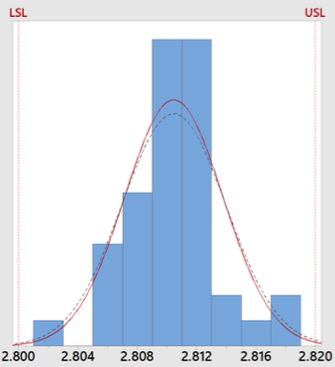
It is better, but still a lot of observations fall out of the specification limits. You decide to control the pressure and the time during the injection process, and then it looks much better:
All the data are within specification. However, the capability index (Cp) is still below 1.00, which is often considered the very minimum. You might need to make further improvements to ensure the variation gets lower, for example by checking the polymer batches the supplier sends to the factory.
A simple way to keep an eye on the parameters (pressure, temperature…) that are suspected to influence greatly the end result is to measure them too… and to calculate their Cp too. Same idea as above. If the main parameters are tightly controlled, the end result should also be tightly controlled.
—
If you are not sure what parameters have a strong influence, you need to use a slightly more advanced statistical tool (multiple analysis of variance).
Similarly, if you need to make experiments to find the best combination (for example, “200 degrees at 100 tons of pressure for 60 seconds”), you need to use another advanced tool (design of experiments).
The key is, start simple. You can go as deep as you want in statistics, but if your processes are simple you can probably get good results by using simple tools, doing a few experiments, and seeing that yields the best result.
—
In summary, basic statistical tools are not very complicated. When made visual, anybody can draw a conclusion from them.
What some Chinese factories really have a hard time understanding is, checking products can tell us a lot about the underlying production processes. And, by improving processes, it is possible to make better products. That’s not the type of thought process they are used to.
—
Related reading: Using Statistical Tools to Improve Processes

