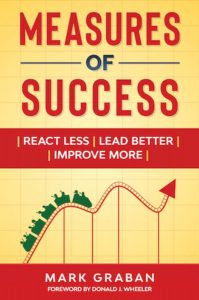
I just read the book Measures of Success by Mark Graban, and I found it does a great job of covering the basics of how managers should work with data.
His whole approach is largely based on concepts from Don Wheeler’s books. If you are not familiar with Don Wheeler, he is the most respected manufacturing-focused statistician of the past 30 years.
Graban covers what to do in two cases managers don’t like to see.
Case 1: an unstable process leading to a widely fluctuating indicator
Wheeler and Graban suggest plotting the data on a graph, and showing a band within which a stable (or “predictable”, as they say) process will usually remain. It is the good old concept of the control plan (or “process behavior chart”, as they say), dating back about 100 years.
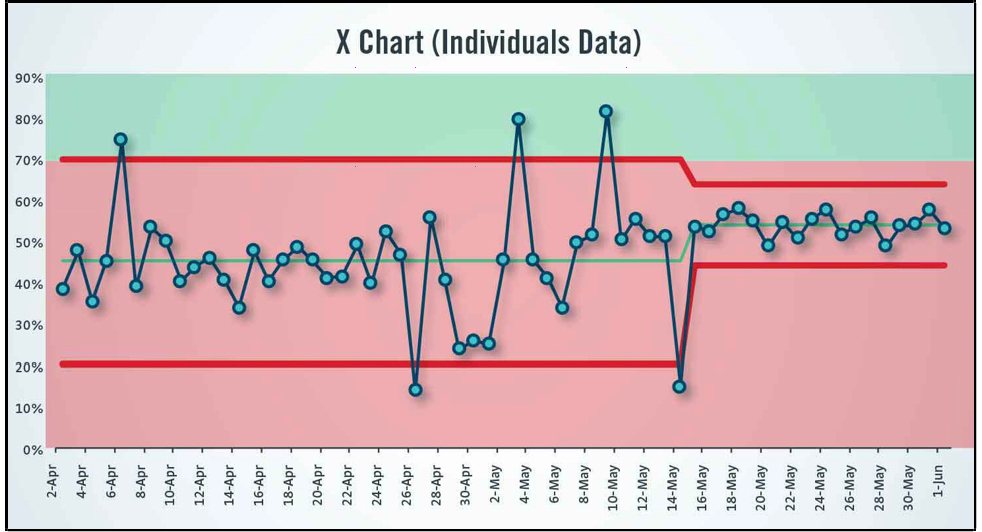
What to do when the process shows instability (with variation wider than it should)?
If we have an unpredictable system, then we work to eliminate the causes of signals, with the aim of creating a predictable system.
In other words, work on stabilizing the process first, before setting targets and working on improving performance.
Graban argues that it is the right thing to do, even when the process is “deep in the red” (below target) as shown below. The right outcome is to narrow the band, before working on getting in the green.
Does it make sense conceptually? Yes. The engineers and operators don’t know what they are doing, or they are greatly impacted by variations in components they get from an upstream process (or by some other serious issue). Fix that first.
If you don’t fix that first, you might make improvements and get performance up into the green, but it won’t be consistently in the green, and the process will still be quite erratic.
It makes a lot of sense in chemical industries, for example. The process might not be mature. Understand what variables impact its output first.
Now, would I do this if I walked in a factory and saw a seriously bad process that can be improved right away? Would I wonder, ‘how to reduce variation?’ vs. ‘how to drive its performance up?”? I don’t think so.
I’d probably start by taking the first step that will have the largest impact for the time & effort invested. And then, I’d wait to see if the related indicator(s) show improvement (including lower variation).
Let’s take a somewhat extreme example. The metal supplier (another plant of the same group) is delivering inconsistent quality, causing a lot of variation in the quality of a stamping machine. And there is an issue with the stamping dies. The best logic to follow is often “fix the process internally first before you request others to make improvements”.
If it means moving average performance up before reducing variation, so be it. It is still an improvement.
Case 2: a stable process that consistently fails to hit the target
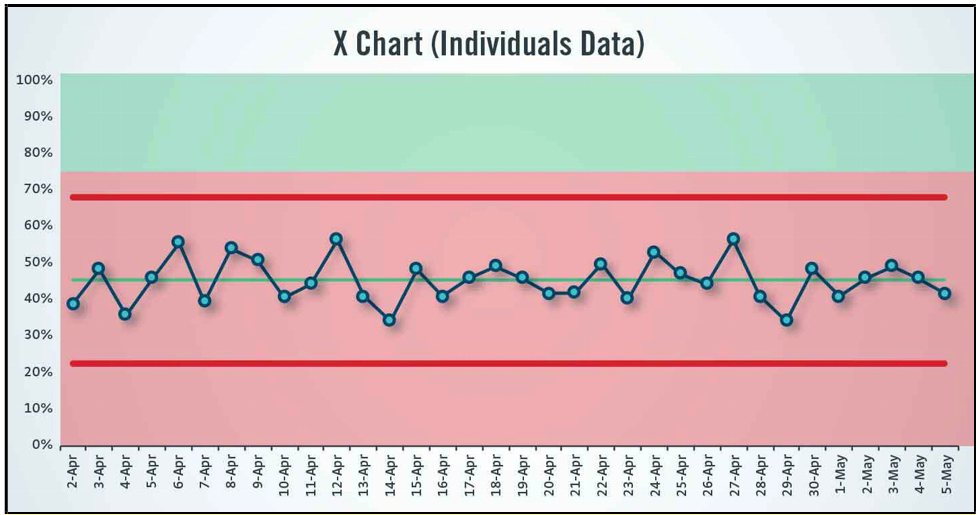
Here is another unpleasant situation. The outcome of a process is always bad!
If we have a predictable system that is not always capable of meeting the target, then we work to improve the system in a systematic way, aiming to create a new system whose results now fluctuate around a better average.
It might look like this:
The obvious approach here is to improve the process to drive its average performance up.
And yet, so many managers get the implementation of that approach wrong. They react to issues that are not at the root cause of the poor performance.
I see this all the time. The process performance is bad, leading to many issues (customer complaints, missed shipments, etc.), and they jump on every fire. They are always busy. As Graban writes:
How to enable long-term improvement in the system
What to do instead? Managers and engineers need to focus on what will enable long-term improvement in the system:
- They need to become proficient at doing root cause analyses.
- They need to push for countermeasures.
- They need to work on it and push other people to do the work.
- They need to recognize that their ideas were not good if indicators don’t show an improvement, and go back to the planning stage
- And they need to be persistent.
All this is not much fun. Better be reactive and be a hero by fixing short-term fires, right?
8 Elements of a Low-Risk Supply Chain in China
This FREE webinar will empower you to transform your supply chain in China to reduce risks. Two industry experts, Renaud Anjoran and Paul Adams from Sofeast, talk you through how to gain control over your product’s quality, on-time shipments, long-term pricing stability, and continuity of supply.
Ready to watch? Register by hitting the button below:


