Do your inspectors find measurements that are different from those declared by the factory? That’s not uncommon if you purchase from China.
Finding out the “why” is not easy. One can do a lot of ‘armchair’ inductive reasoning:
- Maybe the supplier writes values different from what they measure (people are not honest);
- Maybe there is a problem with the CMM program and they get wrong data (a machine is not set properly);
- Maybe the QC operator doesn’t know how to fill out the forms (there are no clear methods);
- Maybe there is no temperature control, so one day the parts will be a bit larger and the next day a little smaller (environment is not managed);
- And so on and so forth.
A good way of studying the supplier’s measurement process and find root cause(s) is to use a fishbone diagram, which is typically structured this way:
Obviously, instead of sitting down in an office and filling this out, you need to go on site and observe how the supplier is measuring your products.
And you can go as deep as you want… For example, let’s say you want to be comprehensive in the ‘Measurement’ section of the analysis.
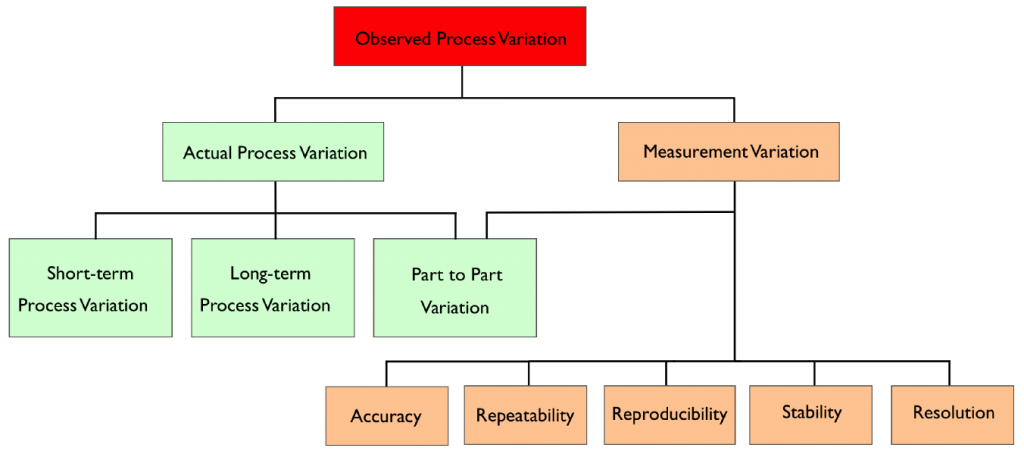
MSA (Measurement Systems Analysis) is a rich field of study, as you can see below.
(Source of this graph: the excellent Gemba Academy blog.)
If the supplier seems to be doing everything right, it makes sense to collect data and run statistical studies. For instance, if it seems the ‘human element’ is important, you need to compare several inspectors’ findings across time (repeatability & reproducibility).
Again, MSA studies can go very deep and are a matter of specialists. Yet, many issues can be found by going through all the possible reasons one by one, methodically, based on first-hand observations, and without involving statistics.


