QualityInspection.org

Quality Assurance, Product Development, and Purchasing Strategies in China

  • Home
  • Articles
    • An Importer’s Guide to New Product Manufacturing in China
  • Best Of
  • About Us
  • Contact us
X

Don't miss a post

It's easy to subscribe to our newsletter where you'll receive weekly updates for professional importers and manufacturers on better understanding, controlling, and improving manufacturing & supply chain in China.

You are here: Home / Quality Control Tips / What Is the Confidence Level when Working with AQL Tables?

What Is the Confidence Level when Working with AQL Tables?

August 1, 2019

What Is the Confidence Level when Working with AQL Tables?

A reader wrote to me and asked the following question about sampling plans by attributes:

What is the “Confidence Level” when using the AQL Tables?

How can we determine what the confidence levels are, and are there formulas we can use?

That’s a valid question. When playing with statistics, one often mentions a confidence interval. For example, “90% of the time, the value will be between 34.5 and 66.0”.

In theory, I guess one could do the same with the values in the AQL tables. There is a formula (but I don’t know anybody who would want to play with a hypergeometric distribution — that’s seriously complicated maths).

However, the statisticians who developed MIL STD 105 (which later became ISO 2859-1, ASQ-ANSI Z1.4, etc.) approached it from another angle and suggested we think about it differently.

The ISO 2859-1 standard comes with a number of operating characteristic curves — the visual representations of that distribution.

And these curves (and the underlying formulae) are based on certain risk levels.

I explained it in the video below:

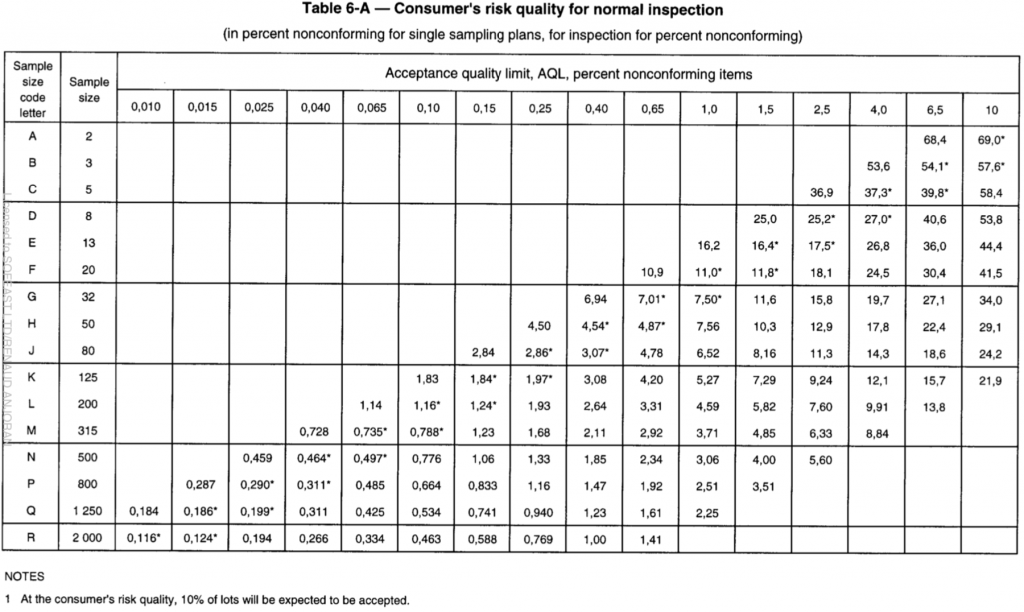
It is also explained in the standard itself. There are tables showing the consumer’s risk and the producer’s risk in different situations.

Let’s look at the risk for the buyer’s side:

EXAMPLE Assume a consumer’s risk quality of 5 % nonconforming items with an associated probability of acceptance of 10 % or less is desired for individual lots. If an AQL of 1 % nonconforming items is designated for inspection of the series of lots, Table 6-A indicates that the minimum sample size shall be given by sample size code letter L.

buyer's risk quality for normal inspection table

In practice, I never saw anybody look at these tables. But that’s the risk for the buyer side. If the risk is 5%, the confidence level is 95%.

—

I hope that was clear. Comments and questions welcome!


Get quick results from our AQL calculator!

If you’re performing random quality inspections we have devised a free online AQL calculator which you can use to quickly find your ideal sample size for your quality inspector to pick and also the tolerable major and minor defects.

>> Go to the AQL calculator << 

Filed Under: Quality Control Tips Tagged With: AQL, Aql Tables, confidence level, confidence levels, quality inspections, quality inspectors, random aql inspection, random sampling aql inspection


Weekly updates for professional importers on better understanding, controlling, and improving manufacturing & supply chain in China.

This is the official blog of Sofeast.com.

This blog is written by Renaud Anjoran, an ASQ Certified Quality Engineer who has been involved in Chinese manufacturing since 2005.

Tweet Renaud here or hit the button below to get in touch.

Contact Us!

Subscribe to our email newsletter

Connect with us

  • Email
  • Facebook
  • LinkedIn
  • RSS
  • Twitter
  • YouTube
sofeast
sofeast
sofeast

Latest Articles

  • What Are the Factory Assessment Reports Shown on Alibaba Worth?
  • How We Set Up A New Factory In China From Idea To Operation [Podcast]
  • Why Your Product’s Final Assembly Should Be Close To Its Key Components
  • A Textbook on Design for Manufacturing and the NPI Process (EVT-DVT-PVT)
  • A New ‘Cold War’ Between The USA & China’s Effect On Manufacturing [Podcast]

Categories

  • Quality Control Tips
  • Sourcing New Suppliers
  • Supplier Management
  • New Product Development
  • Process Improvement
  • Ethical Sourcing

Archives

© 2021 QualityInspection.org