I have long been put off by all the hype around artificial intelligence (AI). AI has become the modern ‘magic wand’: nobody knows how it works, but the results are assuredly amazing. AI has limitations for manufacturers, but both data science and machine learning in manufacturing can help businesses make better decisions and improve quality control results, and it’s these that we’ll explore in this article…
Is modern AI truly a magic wand?
A Wall Street Journal article that just came out (AI Isn’t Magical and Won’t Help You Reopen Your Business) does a good job of putting AI’s advances in perspective.
“A number of studies comparing new and supposedly improved AI algorithms to “old-fashioned” ones have found they perform no better—and sometimes worse—than systems developed years before. One analysis of information-retrieval algorithms, for example, found that the high water mark was actually a system developed more than a decade ago.”
Having said that, there are ways to use a large set of manufacturing- and/or quality-related data for making better decisions. And, in turn, for improving product quality and cutting costs. There are mainly 3 ways to achieve these:
- Improve manufacturing process control, to prevent issues altogether.
- Detect issues very close to the source, to fix them quickly and avoid widespread rework and/or scrap.
- Understand risks better, target inspection & testing activities in a much finer way, and reduce the budget for verification.
What is data science, and how can it help with quality control?
Wikipedia defines it as “an interdisciplinary field that uses scientific methods, processes, algorithms and systems to extract knowledge and insights from structured and unstructured data”.
Working with data, and pulling actionable information out of them, has long been quite useful in many fields. It is usually not part of “artificial intelligence”, even though there can be overlap.
You have probably already played with data and generated useful statistics. You have done what they call ‘data science’!
It starts with a theory. For example, you might buy eyewear products in two geographical areas, and you might wonder if the suppliers in one area seem to be better than in the other. To do that, you can compare the average performance (e.g. % defective goods) of your suppliers in the Shenzhen area vs. those in the Wenzhou area, for a type of eyewear that is made in both those areas. If you already have performance data by supplier, it is not difficult.
Consultant Brad Pritts gave some great tips in How to Use Statistical Tools to Improve Production Processes. He shows that relatively simple statistical tools can be very, very useful.
Has “big data” made this type of work easier?
Yes. The more data you collect into a central database, the more relationships you can test, and the more insights you can uncover. Here are a couple of examples:
- Factory A is 30% more likely to run into dimensional issues than factory B when making the same product.
- In all factories making product category X, after they pass 3 inspections (with low proportions of problems found) in a row, subsequent inspections only fail 2% of the time. Switching to a ‘skip lot’ policy, rather than continuing to check each batch, will probably save the company money.
And, ideally, you’ll re-update these analyses with a certain periodicity, for example, every 3 months. These ‘proven truths’ may change over time. Especially when a pandemic causes a collapse in demand and these suppliers’ organizations might have been affected.
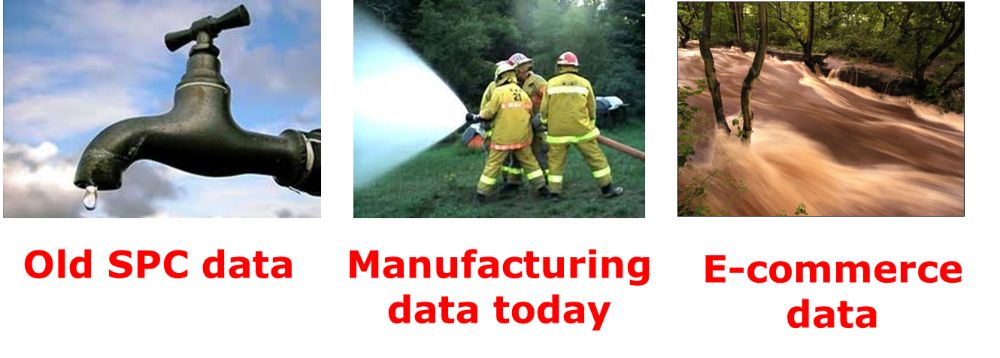
A downside of having a huge amount of data at one’s disposal is, managers need to focus on just what they need. There is a risk of getting submerged (and not knowing where to start), as Michel Baudin put it a few years ago:
How to get all these data into one central database, for running such analyses?
Some companies extract data from different sources and import them all into one database (in Power BI or in Tableau) for easy analysis. Obviously, data integrity (no mistakes, proper labeling, etc…) is quite important.
When an IT application collects a lot of data, it usually tries hard to enable this type of analysis. This has been one of the priorities of the development team of our QC application, so we have been mulling this over for some time.
And if, for example, a user already has one central database, other IT applications have to export their own data in the right format & structure onto that central repository. This has become quite standard and it is quite useful.
Isn’t there more to “data science” than simple statistics?
There is much more to it. Let’s take the example of process control in a die casting workshop.
a) Looking backwards
Let’s say the following data were recorded for each batch over the past 6 months:
- Alloy
- Size/volume of the part
- Pressure
- Mold temperature
- Ambient air humidity
- Cycle time
- Time since previous preventive maintenance stoppage
- Proportion of defective parts (this would be the dependent variable)
With a multivariate analysis, it might be possible to point to certain combinations of process variables that tend to produce the lowest proportion of defects, as well as the combinations to avoid.
b) Looking forward (something AI doesn’t try to do)
If there are no such detailed past data, picking the key variables and making experiments can lead to discovering the ‘process window’ that will tend to yield good quality parts. It can be:
- Relatively simple, by changing one variable at a time and comparing the results;
- Relatively complex, for example by doing a DOE (Design Of Experiments).
What is machine learning in manufacturing (ML), and how can it help quality control?
Machine Learning in manufacturing is the AI approach usually applied to the world of manufacturing (quality, maintenance…). I will only cover the most simple and common form of machine learning — supervised learning.
(For the applications I mentioned below, I discussed with an AI specialist who estimates deep learning would be much more complicated, for very little gain in accuracy.)
It is based on studying input —> output relationships and using the lessons learned to match other inputs to the right outputs.
Supervised learning is commonly used for visual inspection (e.g. recognizing defective parts), self-driving cars (recognizing a red light), and many others. It doesn’t actually get much better with many more data, so most companies won’t need to fit it with millions of inputs & outputs.
The objective is not to get rid of people. To quote the WSJ article again:
“for most businesses, academics, public-health researchers and actual rocket scientists, AI is mostly about assisting humans in making decisions,” says Rachel Roumeliotis, a vice president at O’Reilly Media.
Application 1: Prediction of the level of risk at the PO level
If you have collected a lot of information around past orders (including inputs: quantity, factory grade, area… and outputs such as QC inspection findings), you can probably build an ML model.
Once all the inputs for a PO are known, you can get a risk indicator — for example, from 0 to 100. If the risk is high, spend resources and control that batch closely. If the risk is low, spend far fewer resources.
The key, to get to this point, is to have plenty of accurate data. Here are typical examples:
INPUTS
- Factory, floor, line…
- Type of product (examples: shape, type of material, type of processing…)
- Was it the first batch of this product on this line?
- Order quantity
OUTPUTS
- Defects (and their proportions) found
- Complaints from customers
Application 2: Prediction of the level of risk after final inspections
This is actually a variation on application 1. Should you have suspicions that an inspection’s findings are not accurate, and should you do a 2nd inspection before shipping the goods?
In this case, the inputs are the same as above, but they also include the inspector’s name, his/her past accuracy history, and the details of his findings on this batch.
Application 3: Detecting defects on the lines
Machine vision systems have been used since the 1980s in automotive factories. They have gotten better and cheaper over time, to the point where they can recognize certain defects with a 95%+ accuracy.
For example, the company landing.ai states they can detect scratches, dents, and other similar surface defects with a precision of 99%, and training their algorithm requires a small data set (that probably means fewer than 500 photos for each type of defect).
Their algorithm can also detect mistakes earlier in production by catching missing parts, wrong sequences, wrong positions, wrong measurements, wrong shapes, etc.
As I wrote earlier, the ‘training set” (e.g. the inputs such as photos of 1 type of defect, and the outputs such as OK/NG) may not need to include more than a few tens of photos. However, in some cases, many more are needed.
A few FAQs about machine learning and data science
Q: Does a model just come out ‘out of the blue’ based on data?
Not really. An ML specialist often needs to start with a theory and build a decision tree (example here) to ensure the algorithm pays attention to the right things. He would typically come up with several theories, build several decision trees, and compare the performance of the resulting models.
Q: What is the logical approach — start with data science and then explore what Machine Learning in manufacturing can bring?
Yes. Since the ML specialist needs to have a basic understanding of the relationships between the data (and start with theories), using basic statistics first and uncovering a lot of relationships this way is very useful.
You can read a good explanation about what the specialists in Machine Learning in manufacturing do here. For example, they might have to remove 1 variable that is very highly correlated with another variable.
It is also very important to have an ML specialist review the way data are collected and presented. They might make suggestions that will make their work much easier.
Q: How to make sure a model is really accurate (and avoid trusting it blindly)?
Once a model has been trained, it should be tested on a ‘test set’ (a set of inputs & outputs that are different from those used for training). For example, take 1,000 photos of products, let the algorithm run, and see how many photos are categorized correctly.
This is quite standard in ML. If you engage a consultant that doesn’t plan to work according to these steps, it should trigger an alarm bell…
Q: What about “Deep learning” and “neural networks”?
These terms cover a more advanced form of machine learning. Big data is much more valuable if you have to pick that approach. I’d strongly suggest starting with supervised learning first.
*****
How about you? Has your business started to harness the power of data science and machine learning in manufacturing to improve processes or QC? Leave your comments below, please, or contact me.


